Designing Data Products
Author: Simon O’Regan
Source: https://towardsdatascience.com/
What is a Data Product, and why should you care?
DJ Patil defines a Data Product as “… a product that facilitates an end goal through the use of data”. At first glance, this appears quite broad — is everything on the web a data product? All web-products use data, after all. And for the most part, they use data to facilitate an end goal.
I would add an important distinction here; the distinction between products that use data to facilitate an end goal and products whose primary objective is to use data to facilitate an end goal.
Data products, in the sense that these products demand their own category, are products whose primary objective is centred around data.

Why be so pedantic — well, my argument is that Data Products, whether they be an entire customer-facing product or a partial back-end product, have different characteristics than other technology products.
While many of the standard Product Development Rules apply — solve a customer need, learn from feedback, prioritise relentlessly, etc. — there are subtleties that can make thinking about data products somewhat different.
The definition above is used to discern whether we should be thinking about a product as we typically would or whether we need to consider aspects of product development that are more tailored to world of data.
Some examples
By this measure, let’s take some examples.
Is Medium a Data Product? No, not by our definition; it uses data but it’s primary aim is “ … to build a better publishing platform — one that allows anyone to offer their stories and ideas to the world and that helps the great ones rise to the top”. While data will play a key part in this mission, it is not the primary driver of that goal. Nor is it the objective of Medium — for Medium, data is a means to an end.
If we dig a little deeper within the Medium Platform, we do find products whose purpose is defined by the use of data. Medium’s search function is a data product. The objective is to return relevant articles to the reader and data is central to how that is achieved.
How about Medium’s article feed? Once again, yes — data plays a key part in determining what is shown to the reader.
To take another example: is Gmail a data product? No, Gmail is an email service whose primary objective is to allow asynchronous written communication between individuals. Gmail’s sorting of our emails into Important and Not Important is, however, a data product. The primary objective is to sort emails, and that is centred on natural language processing.
Is Instagram a data product? No. But much of its functionality if considered as discrete products are data products — for example: tagging, search, discovery.
Is Google Analytics a data product? Yes, very much so — its primary objective is bringing a quantitative understanding of online behaviour to the user. Here data is central to the interaction with the user and unlike the other products mentioned thus far, is explicit in its use.
Types of Data Products
Clearly there exists a wide range of different types of data products. Even narrowing down the field of possible products to those that satisfy our definition, there is still considerable variety amongst these products. With this variety comes further subtleties in product development.
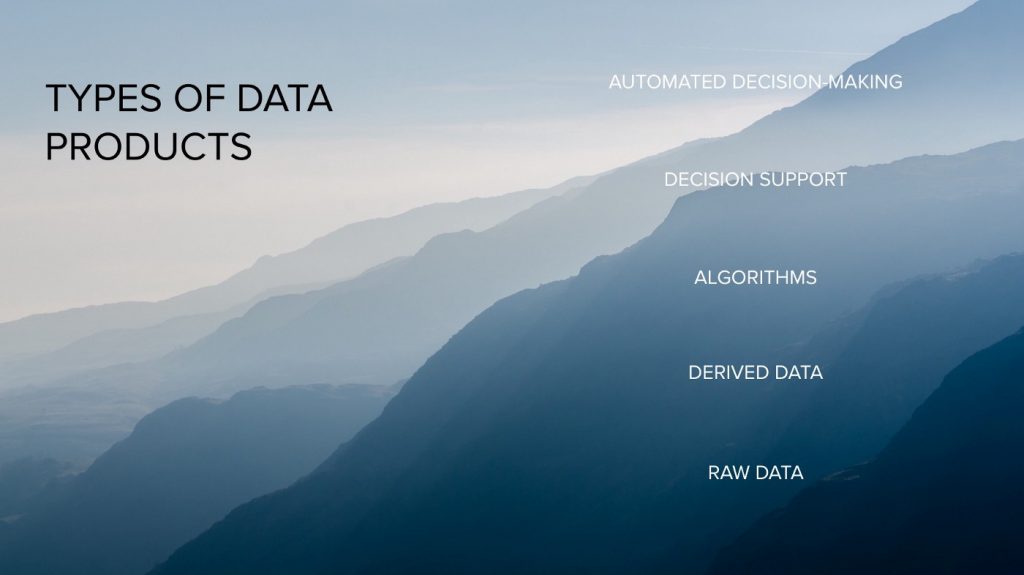
We can organise these data products into 5 broad groups: raw data, derived data, algorithms, decision support and automated decision-making.
Generally speaking these product types are listed in terms of increasing complexity. More specifically, they are listed in terms of increasing internal complexity and (should have) less complexity on the user’s side.
Put another way, the more computation, decision-making or “thinking” the data product does itself, the less thinking required by the user.
Typically (but not exclusively) raw data, derived data and algorithms have technical users. Most often they tend to be internal products in an organisation but counter-examples would include Ad Exchanges, or API suites. Decision support and automated decision-making products tend to have a more balanced mix of technical and non-technical users; though for any given product, the user group tends to be one or the other.
Raw data. Starting with raw data, we are collecting and making available data as it is (perhaps we’re doing some small processing or cleansing steps). The user can then choose to use the data as appropriate, but most of the work is done on the user’s side.
Derived data. In providing users with derived data, we are doing some of the processing on our side. We could, in the case of customer data, add additional attributes like assigning a customer segment to each customer, or we could add their likelihood of clicking on an ad or of buying a product from a certain category.
Algorithms. Next we have algorithms, or algorithms-as-a-service. We are given some data, we run it through the algorithm — be that machine learning or otherwise — and we return information or insights. A good example would be Google Image: the user uploads a picture, and receives a set of images that are the same or similar to the one uploaded. Behind the scenes, the product extracts features, classifies the image and matches it to stored images, returning the ones that are most similar.
Decision support. Here we are looking to provide information to the user to help them with decision-making but we are not taking the decision ourselves. Analytics dashboards such as Google Analytics, Flurry, or WGSN would fall into this category. We are doing most of the heavy lifting on our side; our intention is to give the user relevant information in an easy-to-digest format to allow them to take better decisions. In the case of Google Analytics, that could mean changing the editorial strategy, addressing leaks in the conversion funnel, or doubling down on a given product strategy. The important thing to remember here is as follows: while we have taken design-decisions in data collection, derivation of new data, in choosing what data to display and how to display it, the user is still tasked with interpreting the data themselves. They are in control of the decision to act (or not act) on that data.
Automated decision-making. Here we outsource all of the intelligence within a given domain. Netflix product recommendations or Spotify’s Discover Weekly would be common examples. Self-driving cars or automated drones are more physical manifestations of this closed decision-loop.
We allow the algorithm to do the work and present the user with the final output (sometimes with an explanation as to why the AI chose that option, other times completely opaque).
Data Interactions
So far we’ve discussed functional data product types.
Each of these data products can be presented to our users in a variety of ways — with clear implications for their design. What are these interfaces or interactions?
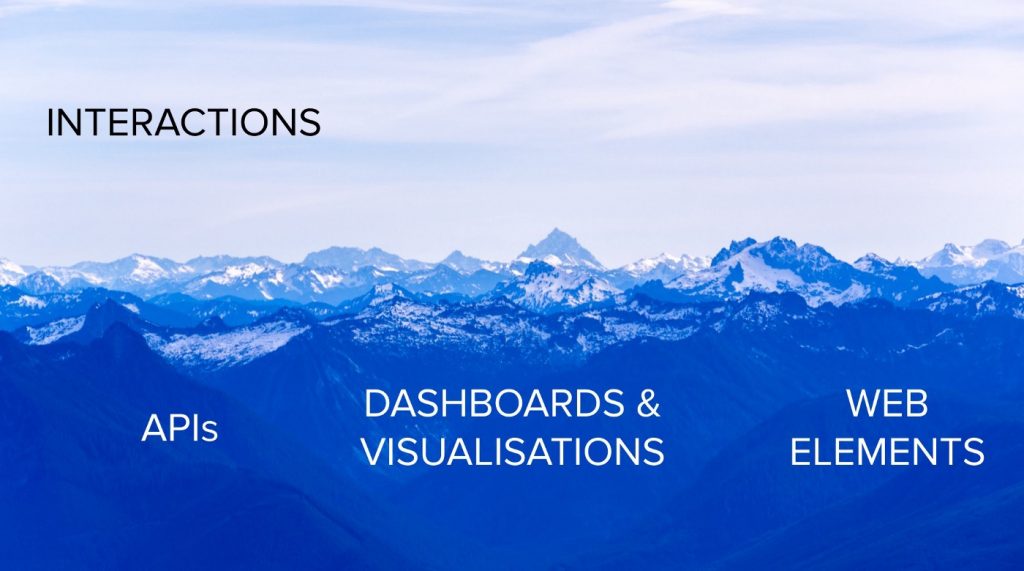
APIs. In the case of APIs, we assume a technical user. We should still follow good Product practices and ensure that the API is intuitive to use, well documented, can do what its user’s need and is desirable to work with.
Dashboards & visualisations. For dashboards, and visualisations we’re assuming some statistical literacy or competence in dealing with numbers. In its most extreme we can do a lot of the heavy-lifting for our users and work hard to ensure that we only present the most pertinent information in an easy-to-understand format. By choosing what information to display, we are influencing decision-making, but it still leaves interpretation and decision-making in the hands (or minds) of the user.
Web elements. For the past 5 years or so the least technical interface for data products that have been commonly seen by users has been web elements. More recently, these interfaces have been broadly extended to include voice, robotics and augmented reality, amongst others. While the design details for each of these newer interfaces are clearly distinctive, there is considerable overlap, in that they revolve around presenting the results of a decision to the user, and perhaps also communicating why or how the AI reached that decision.
Understanding what we’re building
Plotting the types of data products against possible interfaces, we get a matrix of orange dots with each dot representing a different data product variant.
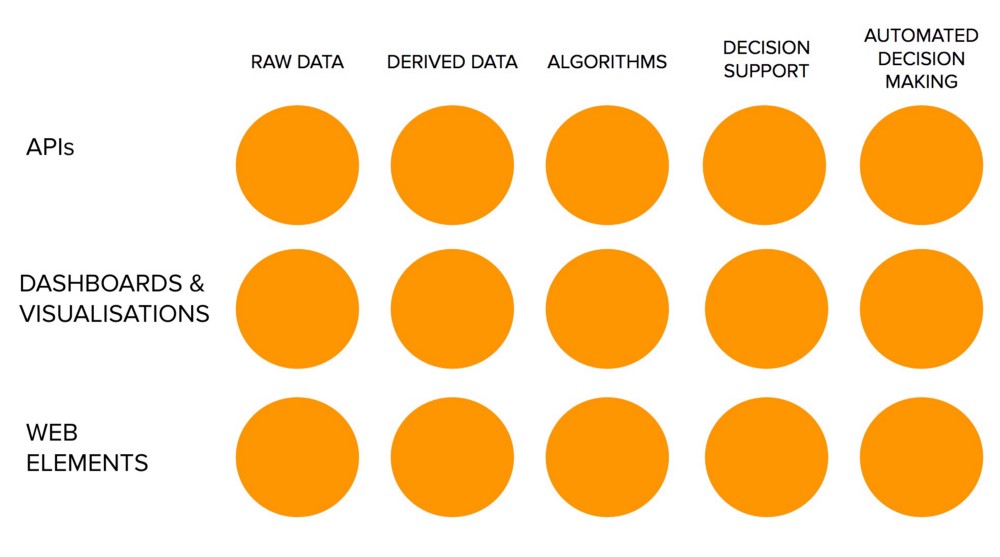
Each element of the matrix demand design considerations that can differ substantially, both in terms of what the user needs and in terms of what design process we use to get there.
Moving diagonally from the top-left circle (Raw data-API) toward the bottom-right circle (Automated decision-making-Web elements) is to move from technical, engineering-driven products towards those that are more typical software products (i.e. products that are more intuitive to product managers and designers, those that tend to appear in books, magazines and articles).
Difficulties & Methodologies
In my experience the biggest problems that teams encounter with data products happen when they apply methodologies like human-centred design on more technical data products. This is not to say that engineers are not human. Most are, and those that aren’t often have an uncanny likeness. But HCD is a holistic approach to product development that excels when the designer understands the motivations and behaviour of the user. For technical data products, the product boundary is often artificially constrained by functional organisation considerations, and the product and UX team is often insufficiently technical to either a) understand the intricacies of technical user behaviour or b) insufficiently inclined to explore these intricacies.
To assume then that the Design-Thinking or Lean methodologies that we’ve been reading about should be applied out-of-the-box is naive.
This is not reason to panic, however.
Though the outputs from the user research may be considerably different to those experienced with consumer-facing or indeed typical SaaS products, and the definition of KPIs may err on the side of the technical, both Design Thinking and Lean are sufficiently malleable to allow us to tailor our approach to this new domain.
My advice then, when applying these methodologies to data products is to ensure that the problem-space is defined in terms of the end user, rather than just the user of the immediate data output. In all likelihood, this will mean expanding the team to include adjacent products and their managers.
Similarly, if the user is a technical one, it is on us to adapt to that context. To empathise with a user experiencing an engineering problem might just mean we have to open an IDE and get coding.